The approach combines BEA Regional Price Parities for relative price levels, ACS state component estimates for category detail, and BLS Consumer Expenditure Survey shares for weighting. Complementary person-level tools such as MIT Living Wage and EPI family budgets help translate price differences into household budgets.
What this guide covers and how to use it
This guide explains how to compare the cost of living by us state using official, public datasets and practical person-level tools. It is written for voters, local residents, journalists, and civic researchers who need a reproducible approach to state-level comparisons.
States with large differences between renter and owner-occupied cost shares, or with rapidly changing housing markets, tend to show the biggest ranking shifts when housing weight assumptions vary. Run sensitivity checks to see the range of outcomes.
The text is informational and neutral. It draws primarily on BEA Regional Price Parities, the ACS state estimates, and the BLS Consumer Expenditure Survey, and it flags where complementary person-level measures can help readers translate prices into budgets BEA Regional Price Parities.
Readers should treat the comparisons here as descriptive rather than prescriptive. Numbers and rankings reflect relative price levels and typical spending patterns; they do not by themselves show whether a household can afford a given place without comparing incomes, taxes, and local supports.
Key data sources and what each one measures
The starting point for state-level price comparisons is BEA’s Regional Price Parities, which report overall state price levels relative to the U.S. average. These RPPs are the standard source for measuring how expensive a state is in broad terms Regional Price Parities by State and Metropolitan Area, 2023.
To understand which categories drive those differences, the American Community Survey provides component-level estimates such as housing costs, utilities, and transportation that are reported at state scale and help explain where price gaps come from American Community Survey 1-Year Estimates, 2023.
The BLS Consumer Expenditure Survey supplies the typical spending shares households allocate to categories like housing, food, transportation, healthcare, and utilities. Those shares are appropriate weights when combining state price levels into a composite, reproducible index Consumer Expenditure Survey – Annual Tables 2023.
Each of these sources has a different measurement role: BEA measures relative price levels, ACS provides component detail and state coverage, and BLS supplies expenditure weights. Used together, they form a transparent basis for a 2026 state comparison.

How to build a transparent 2026 state cost-of-living index
Step 1, start with BEA RPPs as the baseline for relative price levels. Use the RPP value for each state as the price multiplier for broad consumption, treating the national average as the baseline.
Step 2, layer in ACS component data to reflect state differences in key categories such as housing. ACS state estimates identify housing as the single largest household expense and a primary driver of interstate cost differences, so many reproducible indexes adjust housing weights explicitly American Community Survey 1-Year Estimates, 2023.
Get the reproducible template and data update alerts
Download or subscribe for the reproducible calculation template and step-by-step spreadsheet that shows how RPPs, ACS components, and BLS weights combine to form a state index.
Step 3, apply BLS Consumer Expenditure Survey shares to form composite weights across categories so price multipliers map to plausible household spending patterns. BLS shares ensure the index reflects how households typically allocate dollars across housing, food, transport, and other categories rather than treating all categories equally Consumer Expenditure Survey – Annual Tables 2023.
Practical choices are required. For example, some analysts update housing weights to reflect rapid market shifts; such updates should be documented and sensitivity-tested so readers can see how much rankings change when housing weight assumptions vary.

Category-level differences: housing, food, healthcare and more
Housing typically drives the largest share of inter-state cost differences. ACS state estimates consistently show that housing is the largest single household expense and accounts for much of the gap between higher-cost and lower-cost states American Community Survey 1-Year Estimates, 2023.
For grocery and food-price comparisons, USDA ERS provides national and regional price series that document variation across areas and over time; analysts should use those series when comparing food costs separately from broader price indices Food Price Outlook and price series. Tax Foundation also maps purchasing power and can be useful for visual comparisons Purchasing Power Map.
Health care and medical spending vary by state and can move differently than headline price levels. BLS health-care spending series offer a way to compare medical cost shares and should be used when the policy or household question requires a focused view on health expenses Consumer Expenditure Survey – Annual Tables 2023.
Separating categories helps readers see what matters for specific household decisions. A place with an above-average RPP because of housing may still be reasonable for retirees with paid-off homes but costly for renters.
Practical person-level measures: Living Wage and family budgets
Price indices show relative levels, but person-level measures translate prices into the budgets a household needs to meet basic living standards. The MIT Living Wage provides state estimates that function as a benchmark for hourly earnings required to cover basic needs by household type Living Wage Calculator – State Estimates.

The Economic Policy Institute’s family budget calculator builds on price and spending data to produce budgets for different family types and metro areas, which is useful for comparing the practical affordability of places Family Budget Calculator – State and Metro Budgets.
When planning household moves or budgeting, prefer person-level measures when you need to know whether a given income and family composition can meet local costs. Use price indices when the goal is to compare relative price pressure across states rather than to set a budget floor. See the about page for author context.
How to use cost-of-living comparisons when deciding where to live
Compare like-with-like households. If you are a single earner, compare single-earner household budgets or living-wage estimates rather than median household figures that mix family types.
Adjust for income and taxes. Raw price-level rankings can mislead if incomes or state tax structures differ substantially, so consider after-tax income and available transfer programs when interpreting a state comparison Regional Price Parities by State and Metropolitan Area, 2023.
Mind local context. State averages can hide large metro and nonmetro differences. BEA and ACS data are strong at state scale but can be less timely at substate levels, so check local sources for rapid housing changes or regional shocks American Community Survey 1-Year Estimates, 2023.
Limitations, open questions, and rapid market changes
Official series like BEA RPPs and ACS are the best-available public measures, but they are not always fully up to date for rapidly changing local markets. Analysts should be transparent about release dates and versioning when presenting rankings Regional Price Parities by State and Metropolitan Area, 2023.
Substate timeliness is a common gap. RPPs and ACS state estimates may lag metro-level shifts, so treat state averages as a starting point and check local housing indicators for recent, rapid changes American Community Survey 1-Year Estimates, 2023. RPP time series can also be accessed on FRED for trend checks FRED series for RPPs.
Run sensitivity checks on housing weight and price inputs
Use to test alternate housing weight assumptions
When housing or insurance markets are volatile, conduct sensitivity checks that vary housing weights and inspect whether state rankings shift materially; publish those checks alongside headline results so readers can see the range of plausible outcomes.
Common mistakes and how to avoid them
A frequent error is treating index numbers as household budgets. An RPP above the national average means higher relative prices, not how much money a family needs to live. Always pair index comparisons with person-level measures when discussing affordability Regional Price Parities by State and Metropolitan Area, 2023.
Do not rely on a single source without weights. Combining BEA price levels with ACS components and BLS spending shares produces a more transparent and defensible index than using one dataset alone Consumer Expenditure Survey – Annual Tables 2023.
Avoid rounded, unattributed figures. Record the exact versions and release dates of BEA, ACS, and BLS tables you use and publish calculation scripts or spreadsheets so others can reproduce your results. Templates are available on the homepage.
Practical examples and scenarios
Example: comparing two states for a single-earner household. Follow the three-step process: use each state’s BEA RPP as the price multiplier, apply ACS component detail for housing and other categories, then weight categories with BLS expenditure shares. Present the result as a relative index and as a person-level translation using MIT or EPI outputs for the household type.
Example: projecting budget needs for a family of four. Use an EPI family-budget output to set the required total income for that family type, and then show how much of the difference comes from housing versus other categories by referencing ACS housing shares and USDA ERS food series for groceries Family Budget Calculator – State and Metro Budgets.
When publishing examples in a voter information context, cite source pages clearly and use language such as according to and states that when summarizing candidate or campaign material. Keep candidate mentions factual and attributed, and provide links to primary records when available.
State highlights and how to read RPP scores
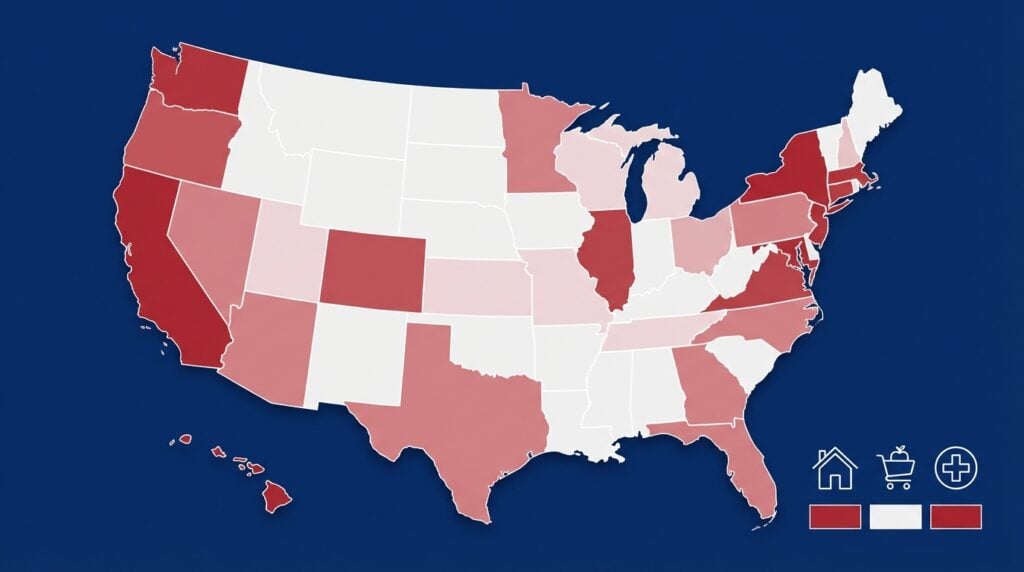
An RPP value above 100 indicates a state with prices above the national average; below 100 indicates below-average price levels. Read the RPP as a relative, not an absolute, measure and use the national average as the baseline Regional Price Parities by State and Metropolitan Area, 2023.
Common regional patterns show many coastal states with higher-than-average RPPs and many Southern and Midwestern states below the national average. These patterns are visible in the BEA state tables and are useful starting points for interpretation. See the FRBSF discussion of changing disparities in prices across states for additional context FRBSF economic letter.
For state-level supporting tables, consult the BEA RPP download pages and the ACS state tables to find the underlying category estimates that explain each state’s score. RPP time series and downloads are also available on FRED FRED.
A short reproducible checklist for writers and civic researchers
Data checklist: record BEA RPP version and release date, the ACS year and table IDs used, and the BLS Consumer Expenditure tables and year. Save the exact table URLs and note any derived calculations.
Reporting checklist: use language like according to and states that when summarizing sourced material, cite the primary page for each factual claim, and publish calculation scripts or spreadsheets so others can reproduce results Consumer Expenditure Survey – Annual Tables 2023.
Reproducibility checklist: include component weights, show the formula used to combine price multipliers and expenditure shares, and provide sensitivity checks for key assumptions such as housing weight updates.
Further reading and official data access
Primary pages to consult include the BEA RPP page for state and metro price parities, the ACS release information for 1-year state estimates, and the BLS Consumer Expenditure annual tables for spending shares Regional Price Parities by State and Metropolitan Area, 2023.
Complementary resources that translate prices into household needs are the MIT Living Wage and the EPI family-budget tools; use them to move from relative price comparisons to concrete budget guidance Living Wage Calculator – State Estimates.
Keep data current by watching BEA, Census, and BLS release calendars and by updating calculation scripts when new RPP or ACS tables are released. See the news page for updates.
Conclusion: reading state-level cost information responsibly

BEA RPPs, ACS state estimates, and BLS expenditure shares together form the strongest public basis for comparing cost of living by state. Use them transparently, publish versions and scripts, and complement price indices with person-level measures when discussing budgets American Community Survey 1-Year Estimates, 2023.
Responsible reporting notes limitations, conducts sensitivity checks for housing and insurance volatility, and attributes all claims to primary sources rather than presenting rounded, unreferenced rankings.
BEA RPPs measure relative price levels across states and compare prices to the national average. A living-wage estimate translates local prices and typical spending into an hourly wage needed to cover basic needs for a given household type.
Not directly. RPPs show relative price pressure. To set a budget, combine RPPs with expenditure shares and use person-level tools like the MIT Living Wage or EPI family budgets to translate prices into income requirements.
Check release dates and versions of the underlying RPP, ACS, and BLS tables, inspect local housing and insurance market indicators for recent shocks, and run sensitivity checks with different housing weights.
If you need a reproducible spreadsheet or help interpreting a state comparison, follow the steps in the checklist and consult the primary pages listed in the main text.
References
- https://www.bea.gov/data/prices-inflation/regional-price-parities-state-and-metro-area
- https://www.census.gov/programs-surveys/acs/news/data-releases/2023/1-year.html
- https://www.bls.gov/cex/annual.htm
- https://www.ers.usda.gov/data-products/food-price-outlook/
- https://taxfoundation.org/data/all/state/purchasing-power-real-value-100/
- https://livingwage.mit.edu
- https://michaelcarbonara.com/contact/
- https://www.epi.org/resources/budget/
- https://fred.stlouisfed.org/series/DCMPRPPALL
- https://www.frbsf.org/research-and-insights/publications/economic-letter/2025/04/changing-disparity-in-prices-across-states/
- https://michaelcarbonara.com/about/
- https://michaelcarbonara.com/
- https://michaelcarbonara.com/news/
{“@context”:”https://schema.org”,”@graph”:[{“@type”:”FAQPage”,”mainEntity”:[{“@type”:”Question”,”name”:”Which states change most when housing weight assumptions are adjusted?”,”acceptedAnswer”:{“@type”:”Answer”,”text”:”States with large differences between renter and owner-occupied cost shares, or with rapidly changing housing markets, tend to show the biggest ranking shifts when housing weight assumptions vary. Run sensitivity checks to see the range of outcomes.”}},{“@type”:”Question”,”name”:”How do BEA RPPs differ from a living-wage estimate?”,”acceptedAnswer”:{“@type”:”Answer”,”text”:”BEA RPPs measure relative price levels across states and compare prices to the national average. A living-wage estimate translates local prices and typical spending into an hourly wage needed to cover basic needs for a given household type.”}},{“@type”:”Question”,”name”:”Can I use state RPPs to set a household budget?”,”acceptedAnswer”:{“@type”:”Answer”,”text”:”Not directly. RPPs show relative price pressure. To set a budget, combine RPPs with expenditure shares and use person-level tools like the MIT Living Wage or EPI family budgets to translate prices into income requirements.”}},{“@type”:”Question”,”name”:”What should I check when a state’s ranking changes a lot between releases?”,”acceptedAnswer”:{“@type”:”Answer”,”text”:”Check release dates and versions of the underlying RPP, ACS, and BLS tables, inspect local housing and insurance market indicators for recent shocks, and run sensitivity checks with different housing weights.”}}]},{“@type”:”BreadcrumbList”,”itemListElement”:[{“@type”:”ListItem”,”position”:1,”name”:”Home”,”item”:”https://michaelcarbonara.com”},{“@type”:”ListItem”,”position”:2,”name”:”Blog”,”item”:”https://michaelcarbonara.com/blog”},{“@type”:”ListItem”,”position”:3,”name”:”Artikel”,”item”:”https://michaelcarbonara.com”}]},{“@type”:”WebSite”,”name”:”Michael Carbonara”,”url”:”https://michaelcarbonara.com”},{“@type”:”BlogPosting”,”mainEntityOfPage”:{“@type”:”WebPage”,”@id”:”https://michaelcarbonara.com”},”publisher”:{“@type”:”Organization”,”name”:”Michael Carbonara”,”logo”:{“@type”:”ImageObject”,”url”:”https://lh3.googleusercontent.com/d/1eomrpqryWDWU8PPJMN7y_iqX_l1jOlw9=s250″}},”image”:[“https://lh3.googleusercontent.com/d/1LO9L4T6YPMasZwZO7Z99uKoa-b5axrrS=s1200″,”https://lh3.googleusercontent.com/d/19WNTE9WwmAmtutSNe2XUFxoFqZE-1Etm=s1200″,”https://lh3.googleusercontent.com/d/1eomrpqryWDWU8PPJMN7y_iqX_l1jOlw9=s250”]}]}