
The goal is practical: help voters and local residents, including those researching candidate information in Florida's 25th Congressional District, understand the data behind safety headlines and how to check primary sources before making decisions.
Quick answer: Safety versus cost for the least expensive states to live in the united states
Short summary for readers who want a direct answer: there is no single nationwide winner that all measures agree on. Composite indices that combine crime, disaster risk, and other safety factors named Maine the top-ranked state in 2024, while administrative FBI counts place New Hampshire among the states with the lowest reported violent-crime rates in 2023, so the result depends on which metric you choose and the year you use for comparison. WalletHub methodology
Put simply, a headline that says one state is “the safest” usually reflects a particular approach to measurement rather than a universal fact. If you are also asking about the least expensive states to live in the united states, safety and affordability do not always move together; some states with strong safety profiles have mixed cost-of-living and income patterns, so compare both sets of data before deciding. U.S. Census QuickFacts
Join Michael Carbonara's updates and stay informed
Read on for the methods, data sources, and practical steps you can use to compare safety and cost before deciding where to move.
Why metric choice changes the single-state answer
Different measurement choices produce different answers because indexes and counts emphasize different phenomena. A composite index can include traffic fatalities, workplace safety, and disaster exposure as well as crime, while administrative counts record offenses known to police. That means a state can score very well on composite measures yet not be the one with the lowest reported violent-crime rate. WalletHub methodology
For readers who want a quick decision, decide first whether you mean “least risk of violent crime” or “broad safety across many hazards and outcomes.” The former points you to administrative or survey crime measures, and the latter points you to composite indices that weight several kinds of safety. Both approaches have value, but they answer slightly different questions. FBI Crime Data Explorer
How experts measure ‘safest’ states
Composite indices versus administrative counts
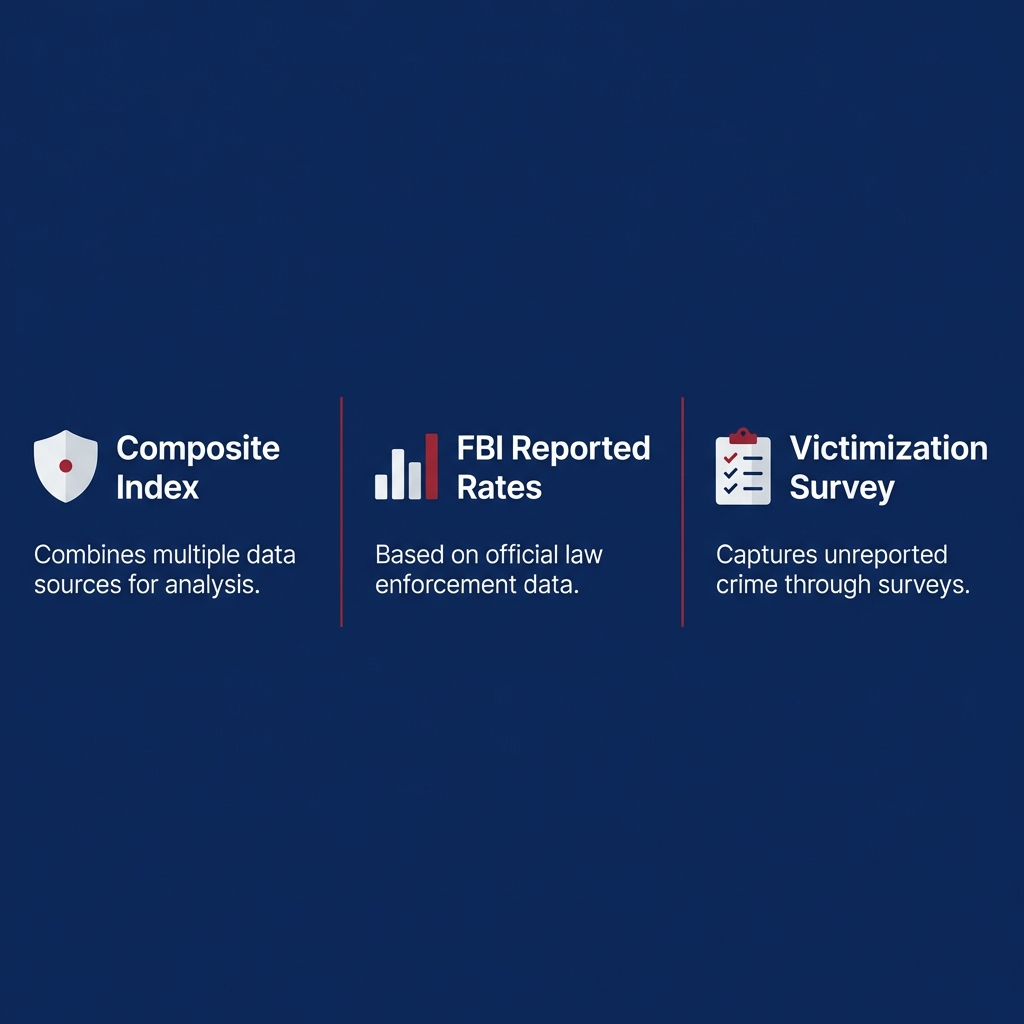
Composite indices aggregate many indicators into a single score so readers can compare states on a broad concept of safety. Those indicators commonly include violent and property crime rates plus traffic fatalities, natural-disaster risk, and workplace or home safety metrics, and the chosen weights for each indicator shape the final ranking. Because composites combine many factors, they can change a state’s position relative to raw crime lists. WalletHub methodology
Administrative counts are produced by law enforcement agencies and compiled in national systems such as the FBI’s Uniform Crime Reporting program. These reported-offense counts show incidents brought to police attention, which makes them concrete and useful for tracking law enforcement workload and year-to-year administrative trends, but they do not capture incidents that do not reach police. FBI Crime Data Explorer
Surveys and other safety indicators
Survey-based approaches such as the Bureau of Justice Statistics National Crime Victimization Survey estimate victimization whether or not it was reported to police, so they can reveal incidents missing from administrative counts and offer a different perspective on how safe people feel and actually are. The NCVS also supports long-term trend analysis that can differ from year-to-year police data. Bureau of Justice Statistics NCVS
Experts often recommend consulting multiple data sources-administrative, survey, and composite-to triangulate a reliable picture of safety for a given purpose, because each source answers a slightly different question about risk and exposure. FBI Crime Data Explorer
Reported crime counts: what FBI data show
Understanding reported-offense rates
The FBI Crime Data Explorer and the Uniform Crime Reporting program present offenses known to law enforcement, organized by state and year, and these administrative counts are the main public record for reported crime trends. They are useful for comparing reported violent and property crime rates across states and for monitoring year-to-year changes. FBI Crime Data Explorer
Which data should I trust?
There is no single definitive answer; composite indices named Maine safest in 2024 while FBI reported-offense data for 2023 highlighted New Hampshire's low violent-crime rates, so the safest state depends on the metric and year used.
Reported-offense counts are not a complete census of all crime because they only include incidents that reach police and get recorded, and reporting practices can vary between jurisdictions and over time. That variability makes it important to review the FBI data alongside survey estimates and local reporting notes before declaring a state definitively “safest.” FBI UCR 2023
Which states had low violent-crime rates in 2023
FBI 2023 state-level reported-offense data placed New Hampshire among the states with the lowest violent-crime rates for that year, which is a valuable indicator if your primary concern is reported violent crime. Use the state filters and rate calculations in the FBI data tool to compare per-capita rates rather than raw counts. FBI UCR 2023
Keep in mind that year-to-year fluctuations occur and that smaller states can show larger percentage swings because of population size, so interpret single-year ranks cautiously and look for multi-year patterns where possible. Bureau of Justice Statistics NCVS
Victimization surveys and long-term trends
What the NCVS measures
The NCVS surveys households to estimate victimization incidents whether or not they were reported to police, capturing a wider set of experiences than administrative counts. Survey methods can reveal underreporting in police data and provide a complementary view of personal and household safety that matters for lived experience. Bureau of Justice Statistics NCVS

Long-term declines and short-term variability
BJS findings and FBI UCR publications show that many crime categories declined substantially from peak levels in the 1990s, yet year-to-year variability remained through 2022 and 2023, so long-term context is important when interpreting recent changes. For decisions tied to multi-year trends, survey estimates and long series help avoid overreacting to a single year’s shift. Bureau of Justice Statistics NCVS
Because surveys and administrative counts use different collection methods and populations, comparing them side by side helps identify reporting gaps, areas with lower reporting rates, and where perceptions of safety diverge from recorded incidents. FBI Crime Data Explorer
Composite safety indices: how WalletHub ranked Maine safest in 2024
What indicators WalletHub used
WalletHub’s 2024 composite ranking used 52 indicators spanning violent and property crime, traffic fatalities, natural-disaster risk, workplace and home safety, and other measures to produce an overall safety score for each state, and that aggregation placed Maine at the top in 2024. A composite of this breadth is intended to capture several dimensions of risk beyond police-reported offenses. WalletHub methodology

Because composite indices weight different indicators, the final rank depends on the choices made by the index author: which indicators to include, how to standardize them, and what weights to assign. That explains why Maine can be a composite winner even when another state records the lowest violent-crime rate in a given administrative dataset. WalletHub methodology
Why composite rankings can differ from raw crime lists
A composite ranking emphasizes a broad safety concept that may include low natural-disaster exposure or strong workplace safety records in addition to low crime rates, so states with balanced strengths across categories can rise to the top even if they are not the absolute lowest on a single crime metric. That design choice is explicit in index methodology pages. WalletHub methodology
For readers prioritizing one narrow outcome, such as the lowest violent-crime rate, a composite index can be informative but is not a direct substitute for the specific administrative or survey data that track that outcome more narrowly. Use both kinds of sources for a fuller view. FBI Crime Data Explorer
Comparing safety and affordability: are the least expensive states to live in the united states also the safest?
How cost-of-living and median income relate to safety rankings
Comparisons that pair safety rankings with affordability indicators show they do not always align. States that perform well on composite safety lists such as Maine, New Hampshire, and Vermont have distinct cost-of-living and median-income profiles, so a top safety rank does not automatically mean the state is among the least expensive states to live in the united states. U.S. Census QuickFacts
Median household income, housing costs, and local tax structures influence affordability, and these economic dimensions vary within and across states that rank highly on safety. That is why movers should compare both safety measures and cost data side by side rather than assuming one implies the other. WalletHub methodology
Practical implications for movers
If your priority is both safety and low cost of living, treat the two questions separately: identify the safety metric that matters most to you and then filter states or counties by housing and living-cost data. The U.S. Census QuickFacts is a practical source for median income and other economic context to pair with safety measures. U.S. Census QuickFacts
Because affordability often varies more within states than between them, checking county and city-level housing and income data alongside state-level safety indicators will give a clearer picture for practical relocation choices. FBI Crime Data Explorer
A practical framework for choosing a state: metrics to weigh
Core metrics to check
Step 1, choose and document the primary metric you will use to define safety, for example a composite safety index, an administrative reported violent-crime rate, or a survey-based victimization rate, and record the year of the data you plan to use. That step clarifies comparisons and avoids mixing incompatible measures. FBI Crime Data Explorer
Step 2, gather multiple sources: the FBI Crime Data Explorer for reported-offense counts, the BJS NCVS for survey estimates and long-term trends, and composite methodology pages to see how different factors were weighted. Using all three helps you triangulate where a state stands on the specific risks you care about. Bureau of Justice Statistics NCVS
A quick data-check checklist to apply when comparing states
Use this checklist before final comparisons
How to weigh safety against cost and other priorities
Step 3, rank the metrics by your household priorities. If violent-crime exposure is the main concern, give more weight to reported violent-crime rates or victimization survey estimates. If broad hazard exposure matters, place more weight on composite indices that include disaster risk and workplace safety. WalletHub methodology
Step 4, check local context and patterns. County and city data often diverge from state averages, so verify whether the counties you are considering reflect statewide patterns or are outliers on safety or affordability before making a moving decision. FBI Crime Data Explorer
Decision criteria: what to prioritize when safety and cost conflict
Questions to ask about personal risk tolerance and household needs
Ask whether your priority is reducing violent-crime risk, minimizing property crime, avoiding disaster exposure, or keeping housing costs low, because each of these goals points to different data and weighting choices. Clarifying your personal priorities makes the data actionable. WalletHub methodology
Consider household composition and routine exposures. Families with children, older adults, or workers in high-exposure jobs may weigh different safety elements more heavily than single adults, and those differences should shift how you read the same datasets. U.S. Census QuickFacts
When to favor local statistics over state averages
Favor local statistics when a city or county’s profile differs materially from state averages, for example where a state average appears safe but certain urban centers report higher violent-crime rates. Local police reports, county health and planning documents, and community safety programs offer useful granular context. FBI Crime Data Explorer
Finally, always verify the data year and source. Recent shifts in trend can make older rankings less relevant for an imminent move, so prefer up-to-date tables and note whether a number is a multi-year average or a single-year snapshot. Bureau of Justice Statistics NCVS
Common mistakes when interpreting ‘safest state’ claims
Metric and year mismatches
One common mistake is presenting a single-state “winner” without specifying which metric and which year were used; that practice creates misleading impressions because different metrics and years can point to different leaders. Always look for the methodology and data year when you see a safety headline. FBI Crime Data Explorer
Another frequent error is assuming composite rankings and raw reported-offense lists are interchangeable. They are not, and mixing them without recalculating weights or aligning definitions leads to faulty comparisons. WalletHub methodology
Overreliance on single-source headlines
Headlines that proclaim one state safest often condense complex methodology into a prize phrase, which is useful for quick reading but poor for decision-making. Verify the underlying data and, when possible, consult the original methodology page to see which indicators were decisive. WalletHub methodology
Population size effects also matter: small states can show large proportional changes from modest shifts in counts, so interpret percentage changes and ranks for less populous states with caution. Bureau of Justice Statistics NCVS
Local examples: what Maine, New Hampshire, and Vermont illustrate
Maine as a composite top-ranked state
WalletHub placed Maine as the safest state in its 2024 composite ranking by combining 52 indicators across crime, disaster risk, and safety measures, which rewarded states with balanced strengths across those categories. That composite view explains Maine’s placement as a broad safety leader in that index. WalletHub methodology
Maine’s composite win does not mean it is automatically the lowest on every crime metric, but it does indicate relatively strong performance across a wider set of safety indicators than a single crime rate would capture. WalletHub methodology
New Hampshire’s low reported violent-crime rate
By contrast, FBI reported-offense data for 2023 identify New Hampshire among the states with the lowest reported violent-crime rates that year, which matters if your priority is minimizing exposure to reported violent incidents. Use rate calculations and per-capita comparisons in the FBI tools to compare states on this measure. FBI UCR 2023
Vermont and neighboring New England states often show strong safety profiles across several measures but have differing affordability and income patterns, so regional similarity on safety does not translate into uniform cost-of-living outcomes. U.S. Census QuickFacts
How movers should check current data before deciding
Step-by-step data checks
Step 1, consult the FBI Crime Data Explorer for reported-offense counts and filter by state and year to get per-capita rates and trend charts that match the period you care about. Comparing rates rather than raw counts helps account for population differences. FBI Crime Data Explorer
Step 2, check the BJS NCVS for survey-based victimization estimates and long-term trend context, which can reveal underreporting and perception gaps that do not show up in police records. Bureau of Justice Statistics NCVS
Primary sources to bookmark
Step 3, review composite rankings and their methodology pages such as WalletHub’s to understand which non-crime indicators were included and how they were weighted, and use Census QuickFacts for median income and other affordability context. WalletHub methodology
Step 4, supplement statewide sources with county and city data as needed, because local conditions often determine daily exposure to risk and housing costs more than state averages do. U.S. Census QuickFacts
Short answers to common reader questions
Quick Q and A
Q: Which state is the safest in the US? A: The answer depends on the metric; WalletHub’s composite index named Maine the safest in 2024, while FBI reported-offense data for 2023 put New Hampshire among the states with the lowest violent-crime rates. WalletHub methodology
Q: Have crime rates trended down over the long term? A: Yes, BJS and FBI publications show many crime categories declined since the 1990s, though year-to-year variation continued through 2022 and 2023. Bureau of Justice Statistics NCVS
When to seek more detailed sources
Seek the original data when you need precise counts, multi-year averages, or local-level numbers before making a move; primary sources include the FBI Crime Data Explorer, BJS NCVS reports, WalletHub methodology pages, and Census QuickFacts. FBI Crime Data Explorer
Final takeaways
Three clear points to remember
First, metric selection drives who appears “safest”: WalletHub’s composite methodology placed Maine at the top in 2024, while FBI reported-offense data highlighted New Hampshire’s low violent-crime rates for 2023, illustrating the divergence that can occur across sources. WalletHub methodology
Second, safety rankings do not automatically indicate low cost of living; use Census QuickFacts and cost measures to compare affordability when you ask which are the least expensive states to live in the united states. U.S. Census QuickFacts
How to use this article’s framework
Use the checklist and the primary sources suggested here to pick the metric you care about, gather aligned data for the same year, and check local statistics before making any relocation decision. That process reduces the risk of drawing the wrong conclusion from a single headline. FBI Crime Data Explorer
Where to find primary sources and next steps
Key data sources to consult
Bookmark the FBI Crime Data Explorer and the UCR publications for reported-offense counts and per-capita rates, and use their filters to compare states and years directly. FBI Crime Data Explorer
Consult the Bureau of Justice Statistics NCVS for survey-based victimization estimates and long-term trend context, and review WalletHub’s methodology page and Census QuickFacts for composite methods and affordability context. Bureau of Justice Statistics NCVS
How to read methodology pages
On methodology pages, look for the indicator list, how indicators are standardized, and the weighting scheme. Those elements explain why a composite index ranks states the way it does and whether its priorities match yours. WalletHub methodology
If you plan a move, re-check data just before finalizing plans because rankings can change as new annual releases become available. FBI UCR 2023
For related posts and category pages, see the homepage.
Use the checklist and the primary sources suggested here to pick the metric you care about, gather aligned data for the same year, and check local statistics before making any relocation decision. That process reduces the risk of drawing the wrong conclusion from a single headline. FBI Crime Data Explorer
Step 3, review composite rankings and their methodology pages such as WalletHub’s to understand which non-crime indicators were included and how they were weighted, and use Census QuickFacts for median income and other affordability context. WalletHub methodology

WalletHub's 2024 composite ranking placed Maine first based on 52 indicators covering crime, disaster risk, and other safety measures.
FBI state-level reported-offense data for 2023 list New Hampshire among the states with the lowest reported violent-crime rates that year.
No, safety rankings and cost-of-living indicators are separate; states that rank high on safety can have mixed affordability profiles according to Census data.
References
- https://wallethub.com/edu/safest-states/8952
- https://www.census.gov/quickfacts/fact/table/US/PST045224
- https://cde.ucr.cjis.gov/LATEST/webapp/
- https://bjs.ojp.gov/library/publications/criminal-victimization-2022
- https://www.fbi.gov/how-we-can-help-you/more-fbi-services-and-information/ucr
- https://cde.ucr.cjis.gov/
- https://ucr.fbi.gov/crime-in-the-u.s/2023
- https://bjs.ojp.gov/topics/crime/violent-crime
- https://michaelcarbonara.com/contact/
- https://michaelcarbonara.com/
- https://michaelcarbonara.com/strength-and-security/
- https://michaelcarbonara.com/about/
{“@context”:”https://schema.org”,”@graph”:[{“@type”:”FAQPage”,”mainEntity”:[{“@type”:”Question”,”name”:”Which single state is the safest in the United States?”,”acceptedAnswer”:{“@type”:”Answer”,”text”:”There is no single definitive answer; composite indices named Maine safest in 2024 while FBI reported-offense data for 2023 highlighted New Hampshire’s low violent-crime rates, so the safest state depends on the metric and year used.”}},{“@type”:”Question”,”name”:”Which state is the safest according to composite rankings?”,”acceptedAnswer”:{“@type”:”Answer”,”text”:”WalletHub’s 2024 composite ranking placed Maine first based on 52 indicators covering crime, disaster risk, and other safety measures.”}},{“@type”:”Question”,”name”:”Which state had low reported violent-crime rates in 2023?”,”acceptedAnswer”:{“@type”:”Answer”,”text”:”FBI state-level reported-offense data for 2023 list New Hampshire among the states with the lowest reported violent-crime rates that year.”}},{“@type”:”Question”,”name”:”Does a high safety ranking mean low cost of living?”,”acceptedAnswer”:{“@type”:”Answer”,”text”:”No, safety rankings and cost-of-living indicators are separate; states that rank high on safety can have mixed affordability profiles according to Census data.”}}]},{“@type”:”BreadcrumbList”,”itemListElement”:[{“@type”:”ListItem”,”position”:1,”name”:”Home”,”item”:”https://michaelcarbonara.com”},{“@type”:”ListItem”,”position”:2,”name”:”Blog”,”item”:”https://michaelcarbonara.com/blog”},{“@type”:”ListItem”,”position”:3,”name”:”Artikel”,”item”:”https://michaelcarbonara.com”}]},{“@type”:”WebSite”,”name”:”Michael Carbonara”,”url”:”https://michaelcarbonara.com”},{“@type”:”BlogPosting”,”mainEntityOfPage”:{“@type”:”WebPage”,”@id”:”https://michaelcarbonara.com”},”publisher”:{“@type”:”Organization”,”name”:”Michael Carbonara”,”logo”:{“@type”:”ImageObject”,”url”:”https://lh3.googleusercontent.com/d/1eomrpqryWDWU8PPJMN7y_iqX_l1jOlw9=s250″}},”image”:[“https://lh3.googleusercontent.com/d/1WqoM2Z6T41_F9634q0Dtfy3e8Nkfkjuw=s1200″,”https://lh3.googleusercontent.com/d/1jqfEcF2M1WFUD1TML5yU0l9QP3esnnIZ=s1200″,”https://lh3.googleusercontent.com/d/1eomrpqryWDWU8PPJMN7y_iqX_l1jOlw9=s250”]}]}