The goal is to give a clear, sourced picture without promising outcomes. Where applicable, the article points to the ACS median gross rent table and to private indexes so readers can check original tables and recent trends.
Quick answer: which states have the cheapest states to live in in the united states
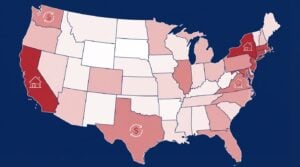
The short answer is that the lowest median rents are clustered in parts of the Southeast and the Midwest, not spread evenly across the country. This takeaway follows the U.S. Census American Community Survey 2024 median gross rent table as the state-level benchmark ACS Table B25064.
Private indexes generally show the same regional pattern, though they can change the rank order for individual states because they use listing and asking-rent samples rather than occupant-reported rents Zillow ZORI data.

Short summary
Across standard 2024 measures, state medians are lowest in several Southeastern and Midwestern states and highest in much of the Northeast and many coastal Western states. The ACS table remains the authoritative state median source for comparisons ACS Table B25064. See the Michael Carbonara site for related posts.
Top low-rent states by ACS median gross rent
State-level lists vary by source, but the ACS 2024 medians provide the consistent benchmark used by researchers and reporters comparing state rents year to year ACS Table B25064.
Why median gross rent is the standard benchmark and what it measures
What ACS median gross rent includes
The ACS median gross rent reports the median of gross rent paid by renter-occupied housing units in the one-year survey sample; it captures the value renters themselves report to the Census Bureau ACS Table B25064. See the Census Reporter table B25064.

Differences between reported gross rent and asking rents
Because ACS uses a household survey of renter-occupied units, it measures what households report paying rather than the prices landlords advertise; the difference matters for short-term trend tracking and for listing-heavy markets ACS methodology and concepts.
For state-level benchmarking, researchers often prefer ACS 1-year medians for cross-state comparisons because they use a consistent survey frame at the state scale ACS Table B25064.

How private rent indexes compare to the official data (and why rankings can differ)
Zillow ZORI vs ACS
Zillow ZORI tracks observed asking rents using listing and payment flows, which can respond faster to recent market moves than ACS household reports; that responsiveness can change a state’s rank in short windows Zillow ZORI data.
Because ZORI samples asking prices and the ACS samples occupant-reported rents, each can be right for a different purpose: ZORI for recent asking trends, ACS for a broad occupant-based median ACS Table B25064.
State medians from the ACS show lower rents concentrated in parts of the Southeast and the Midwest; renters should use ACS medians as a consistent benchmark, compare them with listing-based indexes for recent trends, and always check metro and unit-size data and local income before making relocation decisions.
Apartment List and RentCafe approaches
Apartment List compiles listing and rental application data to produce a rent series that often mirrors the regional pattern in ACS medians but can differ in state ranking due to sample frame and timing Apartment List national rent report.
RentCafe provides state and unit-type breakdowns based on observed listings and market samples, offering useful unit-size context that can confirm whether a state consistently appears at the low end across different apartment sizes RentCafe state rent tables.
Regional pattern: where the cheapest states tend to be
Southeast and Midwest concentration
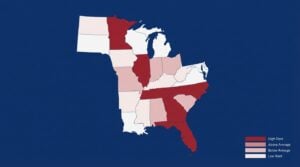
ACS 2024 medians show a clear geographic pattern, with lower median rents concentrated in parts of the Southeast and in several Midwestern states, which is why those regions often top lists of the cheapest states to live in in the united states ACS Table B25064. See the Iowa Data Center summary Gross Rent.
These regional clusters reflect long-standing differences in housing supply, construction costs, and historical income and price levels rather than a single short-term trend Zillow ZORI data.
Contrasts with Northeast and coastal West
By contrast, many Northeastern states and coastal Western states show much higher state medians in the same ACS data, which is why national maps of median rents highlight notable east-west and north-south contrasts ACS Table B25064.
Private indexes generally reproduce the same broad geographic split even when they reorder a few states within each region because market pressures and land costs differ across regions Apartment List national rent report.
Do low median rents hold across unit sizes? Studios, 1BR and 2BR patterns
Unit-size breakdowns from Apartment List and RentCafe
Data from Apartment List and RentCafe for 2024 show that the same low-cost states tend to appear near the bottom of rent listings across studio, one-bedroom and two-bedroom categories, suggesting the state-level affordability pattern is not limited to a single unit type Apartment List national rent report.
This consistency matters because renters seeking different unit sizes often find the same states relatively affordable, though local metro variation still alters specific choices RentCafe state rent tables.
Check the primary rent tables and recent index notes
See the ACS table and private index notes for full data and unit-size breakdowns before drawing relocation conclusions.
What this means for different renter types
For renters comparing options, unit-size consistency across indexes signals that choosing a lower-rent state can plausibly reduce typical apartment costs for singles and small households alike, subject to local market differences Apartment List national rent report.
Always confirm with local listings and recent index trends to see whether a specific metro maintains the same pricing advantage as the state median suggests RentCafe state rent tables. See recent updates on the news page.
Affordability in practice: HUD cost-burden and what lower rents imply
The 30 percent cost-burden rule

Applying the 30 percent rule to state median rents shows that lower medians increase the likelihood a median-income renter avoids cost-burden, though actual outcomes depend on local incomes and household composition ACS Table B25064.
Applying median rents to household income
Because incomes vary within and across states, lower state medians improve the odds of affordability for a typical renter but do not guarantee that all households will be under the cost-burden threshold in any given metro HUD guidance on cost-burden.
Researchers therefore pair median rent data with median income or income distribution measures when estimating how many households are cost-burdened in a state or metro ACS Table B25064.
Methodological caveats every reader should know
Timing, sample frames and unit mix
Different sources use different timing and sample frames; the ACS uses a household survey while private indexes use listing or transaction samples, and those choices can shift a states ranking from year to year ACS methodology and concepts.
Unit mix also matters: a state with many small apartments will show a different median than a state with a larger share of family-sized housing, so analysts must consider the unit-type distribution behind a median Apartment List national rent report.
Compare ACS medians with listing indexes at state and metro level
Use this to track differences side by side
Why year-to-year rankings can change
Migration, local regulation, new construction, and short-term demand shocks can alter asking rents quickly, which is why listing-based indexes sometimes show rapid movement that the ACS survey does not immediately capture Zillow ZORI data.
For responsible reporting, any published state ranking should disclose source, date, and method so readers can interpret whether they are seeing a long-term pattern or a short-lived shift ACS methodology and concepts.
A simple framework to decide if a low-rent state is the right move for you
Checklist: income, job market, taxes, services
Start by pairing state median rent with median income and local job prospects; a low median rent only helps if local wages and employment opportunities match your needs ACS Table B25064.
Also check taxes, healthcare availability, and service access for the counties or metros you are considering, since these factors can offset rent savings in practice RentCafe state rent tables.
How to layer metro and unit-level data
After a state-level screen, refine choices by comparing county and metro medians, recent listing trends, and unit-size prices to see whether the state advantage holds where you would actually live Apartment List national rent report.
Run the simple checklist for each target metro and document the sources and dates you used so comparisons remain apples-to-apples ACS Table B25064. Learn more on the about page.
Decision criteria: which data points to weigh and why
When to prioritize ACS versus listing indexes
Use ACS medians when you need a broad, occupant-reported benchmark that is comparable across states; use listing-based indexes when you need current asking rent trends and market responsiveness ACS Table B25064.
Balancing the two can give both a stable baseline and a sense of recent movement, especially for fast-changing metros Zillow ZORI data.
How unit type and household size change the ranking
Household size shifts which unit type matters, and small households will focus on studio and one-bedroom medians while families need to check two-bedroom and larger unit data to see true affordability Apartment List national rent report.
Include vacancy rates and asking rents in the checklist; a low median with low vacancy may indicate limited choices even if prices are lower on average Zillow ZORI data.
Common mistakes and pitfalls when reading ‘cheapest states’ lists
Mistaking state medians for local market rates
One common error is treating a state median as if it applied uniformly across all counties and metros; in reality, statewide medians can hide expensive metros inside low-cost states ACS Table B25064.
Another pitfall is relying on a single private index without checking its sample and date; different indexes can produce different rankings for methodological reasons Zillow ZORI data.
Ignoring unit-size and income differences
Failing to match unit size and household income to the median used in a ranking can produce misleading conclusions; always compare like with like when possible RentCafe state rent tables.
Verify the unit types behind any headline ranking before using it to inform a relocation decision Apartment List national rent report.
Practical examples: three renter profiles and likely state matches
Single early-career renter on a tight budget
An early-career renter prioritizing low monthly cost can use state medians to narrow options, then check one-bedroom listings and local wages to confirm a workable balance between rent and income Apartment List national rent report.
That renter should also assess transit access and job density in target metros, since lower rent is less useful without local work options ACS Table B25064.
Two-person household with remote work options
Households with remote-friendly jobs can weigh lower state medians more heavily but still need to check healthcare access, internet quality, and tax differences at the county level before moving RentCafe state rent tables.
Use unit-size breakdowns to confirm that two-bedroom options remain affordable in the metros you shortlist Apartment List national rent report.
Retiree seeking low cost and moderate services
A retiree focused on low housing cost should balance state medians with local healthcare availability and property tax considerations, checking county-level service maps in addition to rent tables ACS Table B25064.
For older households, proximity to medical services and stable local providers can matter more than marginal rent savings, so combine medians with local service checks RentCafe state rent tables.
When to dig deeper: metro- and county-level data and next steps
Where to find local rent data
County and metro-level ACS tables, local housing authorities, and market listing sites provide the granularity needed to verify whether a state median advantage shows up where you would actually live ACS Table B25064. See the news page for local updates.
Cross-check the ACS local tables with recent listing indexes to capture both the stable baseline and recent movement before making a move Zillow ZORI data.
How to combine local data with state medians
Start with the state median to screen low-cost regions, then layer on metro medians, unit-size prices, and recent asking trends to reach a shortlist of realistic target metros Apartment List national rent report.
Document each source and date and run the HUD cost-burden check for your own income to see whether median rents translate into affordable payments for your household HUD guidance on cost-burden.
Conclusion: key takeaways about the cheapest states to live in in the united states
Summary of main points
The ACS 2024 median gross rent data show that lower medians concentrate in parts of the Southeast and the Midwest, while the Northeast and many coastal Western states report higher medians; private indexes tend to mirror these regional patterns even when ranks shift ACS Table B25064.
Use HUDs 30 percent cost-burden rule to interpret whether a given median is likely affordable, and always combine state medians with local income and unit-size data before making relocation decisions HUD guidance on cost-burden. For related content see the homepage.
For state-level medians the ACS 1-year median gross rent table is the standard benchmark; use private listing indexes to check recent asking-rent trends and always note the source and date.
Not necessarily; state medians can mask expensive metros inside otherwise low-cost states, so check county and metro data before making decisions.
The HUD rule flags households paying more than 30 percent of income on housing; lower medians increase the chance a median-income renter avoids cost-burden but incomes vary by place.
For voter information about Michael Carbonara and his campaign background, consult his campaign profile and public filings for context on his priorities and statements.
References
- https://data.census.gov/table/ACSDT1Y2024.B25064
- https://www.zillow.com/research/data/#zori
- https://michaelcarbonara.com/contact/
- https://michaelcarbonara.com/
- https://censusreporter.org/tables/B25064/
- https://www.census.gov/programs-surveys/acs/methodology.html
- https://www.apartmentlist.com/research/national-rent-data
- https://www.rentcafe.com/average-rent-market-trends/us/state/
- https://www.iowadatacenter.org/index.php/data-by-source/american-community-survey/gross-rent
- https://www.hud.gov/program_offices/comm_planning/affordablehousing
- https://files.hawaii.gov/dbedt/economic/databook/2024-individual/14/140824.pdf
- https://michaelcarbonara.com/news/
- https://michaelcarbonara.com/about/
{“@context”:”https://schema.org”,”@graph”:[{“@type”:”FAQPage”,”mainEntity”:[{“@type”:”Question”,”name”:”Which states have the cheapest rents and how should renters interpret those rankings?”,”acceptedAnswer”:{“@type”:”Answer”,”text”:”State medians from the ACS show lower rents concentrated in parts of the Southeast and the Midwest; renters should use ACS medians as a consistent benchmark, compare them with listing-based indexes for recent trends, and always check metro and unit-size data and local income before making relocation decisions.”}},{“@type”:”Question”,”name”:”What data source should I trust for state rent comparisons?”,”acceptedAnswer”:{“@type”:”Answer”,”text”:”For state-level medians the ACS 1-year median gross rent table is the standard benchmark; use private listing indexes to check recent asking-rent trends and always note the source and date.”}},{“@type”:”Question”,”name”:”Do low state medians mean a specific city is inexpensive?”,”acceptedAnswer”:{“@type”:”Answer”,”text”:”Not necessarily; state medians can mask expensive metros inside otherwise low-cost states, so check county and metro data before making decisions.”}},{“@type”:”Question”,”name”:”How does the HUD cost-burden rule apply to median rents?”,”acceptedAnswer”:{“@type”:”Answer”,”text”:”The HUD rule flags households paying more than 30 percent of income on housing; lower medians increase the chance a median-income renter avoids cost-burden but incomes vary by place.”}}]},{“@type”:”BreadcrumbList”,”itemListElement”:[{“@type”:”ListItem”,”position”:1,”name”:”Home”,”item”:”https://michaelcarbonara.com”},{“@type”:”ListItem”,”position”:2,”name”:”Blog”,”item”:”https://michaelcarbonara.com/blog”},{“@type”:”ListItem”,”position”:3,”name”:”Artikel”,”item”:”https://michaelcarbonara.com”}]},{“@type”:”WebSite”,”name”:”Michael Carbonara”,”url”:”https://michaelcarbonara.com”},{“@type”:”BlogPosting”,”mainEntityOfPage”:{“@type”:”WebPage”,”@id”:”https://michaelcarbonara.com”},”publisher”:{“@type”:”Organization”,”name”:”Michael Carbonara”,”logo”:{“@type”:”ImageObject”,”url”:”https://lh3.googleusercontent.com/d/1eomrpqryWDWU8PPJMN7y_iqX_l1jOlw9=s250″}},”image”:[“https://lh3.googleusercontent.com/d/14fgU9H61kQ63HWIUQW4t50EV0gXnNtjH=s1200″,”https://lh3.googleusercontent.com/d/176YBYUR_0xdgNJFVuVe8f_N_4_eFaHxU=s1200″,”https://lh3.googleusercontent.com/d/1eomrpqryWDWU8PPJMN7y_iqX_l1jOlw9=s250”]}]}