It is written to help voters, prospective movers and journalists get a sourced, practical view of state price levels in 2026. Where possible, the article points to primary datasets and calculators to run your own comparisons.
Quick answer: Which state tops the cost of living rankings?
Short bottom-line summary: cost of living by us state
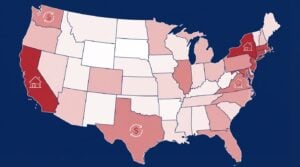
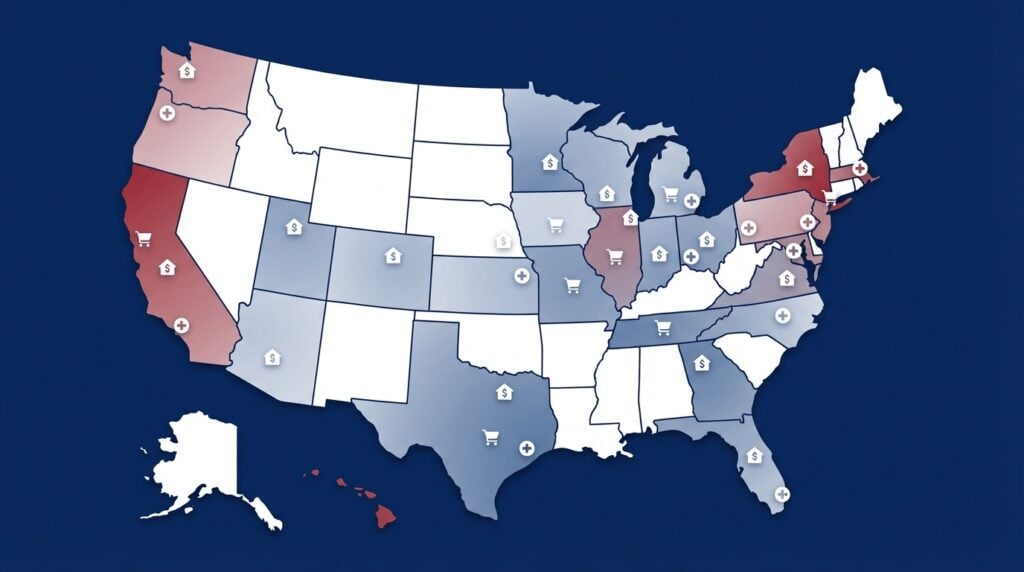
BEA regional price parities show that a small group of states commonly sits at the top of national price-level rankings; California, New Jersey and Hawaii are regularly among the highest-priced states in the latest BEA data BEA regional price parities.
Across those state-level comparisons, housing costs are frequently the largest single contributor to differences in household spending, with high home values and rents pushing overall state price levels upward according to housing market indices and state RPP methodology Zillow research data.

How cost of living is measured: RPPs, CPI and other indexes
What BEA regional price parities measure
BEA regional price parities estimate how price levels compare across states and metro areas by balancing a wide set of consumer goods and services into a single state-level price index, which makes them useful when ranking states by overall price level BEA regional price parities.
How BLS CPI-area series differ
The Bureau of Labor Statistics produces CPI series for regions and urban areas that track month-to-month inflation trends rather than a cross-state price-level snapshot; those series are better for following recent price changes within a region rather than ranking states head-to-head BLS CPI data.
Other useful indexes (Zillow, C2ER, MIT living wage)
For housing-specific comparisons, Zillow home-value and rent indices offer timely measures of local market costs, while C2ER’s Cost of Living Index and living-wage tools add alternative perspectives on budgets and required incomes Zillow research data.
Which U.S. states are the most expensive by overall price level
Common top-ranked states across indexes
Across BEA RPPs and housing measures, states that commonly appear in the top tier include Hawaii, California and New Jersey, with New York, Massachusetts and Maryland also frequently ranked highly because of strong price levels and housing costs BEA regional price parities.
Using BEA regional price parities and housing indices, states such as California, New Jersey and Hawaii commonly appear among the highest-priced; housing is usually the dominant driver and local housing data should be checked for decisions.
Rankings can look different when a single high-cost metro dominates a state’s population or when island jurisdictions lift a state average; metropolitan weighting and the local housing mix matter for how a state ends up in a national list C2ER cost of living resources.
Because rankings depend on the index and year, check the latest BEA release before drawing final conclusions about which state is most expensive for your situation BEA regional price parities.
Why housing is the dominant driver of state cost differences
How home values and rents shape state price levels

Multiple data sources show that housing explains most interstate variation in living costs; measures like median home value and rent indices feed strongly into overall state price-parity calculations and often account for the largest share of differences between expensive and lower-cost states Zillow research data.
High rental demand, limited housing supply and geography can combine to keep housing prices elevated in particular states and metros, which then raises a state’s RPP and its position in cost-of-living rankings BEA regional price parities.
Interaction with local wages and taxes
Housing cost is only one side of affordability; tax structures, local wage levels and available services influence real purchasing power, so a high RPP does not automatically mean every household feels the same pressure MIT living wage estimates.
When evaluating a move, compare expected housing spending with after-tax wages and any differences in state or local taxes to get a fuller picture of likely budget impacts EPI family budget resources.
How groceries, healthcare and utilities affect state cost burdens
Which categories vary less and which vary more
BLS CPI-area data and BEA context show that food, healthcare and utilities typically vary less across states than housing, but they still change the budget picture for many households, especially those with specific medical needs or large families BLS CPI data.
For households where grocery bills or medical costs are a dominant share of spending, even small regional price differences in those categories can be consequential over a year, particularly for seniors or families with young children BEA regional price parities.
Quick personal budget checks using public calculators
Use these inputs with EPI or MIT calculators
To see how groceries, healthcare or utilities will affect your household, run your figures through a state budget tool and compare the outputs; both EPI and MIT provide interfaces to convert category-level costs into required local incomes EPI family budget.
RPPs versus CPI: Which index should you use and when
Use cases for RPPs
Use BEA RPPs when your question is comparative across states or metro areas and you need a single, consistent price-level measure for planning or reporting; RPPs are designed to show how expensive one state is relative to another BEA regional price parities.
Use cases for CPI-area series
Use BLS CPI-area series if you are tracking short-term inflation, local price trends or recent changes in groceries, utilities or healthcare within a region, because CPI is updated monthly and measures movement rather than cross-sectional levels BLS CPI data.
When to combine indexes
For most planning tasks combine RPP state ranks for the broad picture, Zillow or local MLS housing data for up-to-date shelter costs, and a living-wage or family-budget calculator to convert those prices into required incomes or take-home pay comparisons Zillow research data.
A practical decision framework for movers and planners in 2026
Step-by-step checklist
Step 1: Check BEA RPPs for state-level price differences and note the state rank and recent trend to establish the baseline for cross-state comparison BEA regional price parities.
Join Michael Carbonara's campaign updates and practical guides
Consult the primary sources listed in this guide while you gather local housing and wage information, and treat state ranks as a starting point rather than a final budget.
Step 2: Pull local housing data from Zillow or local MLS listings to estimate likely rent or mortgage payments for neighborhoods you are considering Zillow research data.
Step 3: Use a state-specific family-budget or living-wage calculator to convert projected spending into a target household income and compare that to local wage data, adjusting for taxes and typical benefits EPI family budget.
Step 4: Check BLS CPI-area series for the target metro to understand recent inflation pressures, especially for groceries, healthcare and utilities that may not move in lockstep with housing BLS CPI data.
Final check: Revisit the latest local housing indices and state resources immediately before any firm decision, since housing markets can shift seasonally and with changing demand Zillow research data.

Common mistakes and pitfalls when using cost-of-living data
Misreading averages and medians
A common error is treating a state average as if it represented every metro or neighborhood; large states can include both very expensive metros and lower-cost rural areas, so medians and metro-specific measures matter C2ER guidance.
Another frequent mistake is relying on outdated housing data; because housing often drives differences, using stale rent or price numbers can mislead planning choices Zillow research data.
Overreliance on a single index
Using only headline ranks without checking wages, taxes or category-specific costs can produce misleading results; a multi-index approach reduces the risk of overinterpreting a single number BEA regional price parities.
Practical examples: Comparing two move destinations
Example 1: High-cost coastal state versus lower-cost inland state
Imagine comparing a coastal state with a high RPP and elevated Zillow rents to an inland state with a lower RPP and more moderate housing costs; start with the BEA rank, then substitute local rent or mortgage estimates into a family budget tool to see net effects on monthly spending BEA regional price parities.
Use EPI or MIT living-wage outputs to turn those cost differences into target income levels and check whether typical local wages or employer benefits will cover that gap EPI family budget.
How to adjust a household budget
Practical adjustments include modeling a conservative rent or mortgage estimate, adding a buffer for healthcare and groceries based on CPI-area trends, and testing scenarios where one partner’s expected wages differ from the local median BLS CPI data.
Remember that the real-dollar impact of moving depends on the specific metro and neighborhood rather than the state average alone, so local MLS and neighborhood rental listings are essential final checks Zillow research data.
Conclusion: Key takeaways and where to check next
BEA RPPs identify states such as California, New Jersey and Hawaii among the highest price-level states, and housing is the major driver of those differences, so prioritize shelter costs when comparing states BEA regional price parities.
Before making any major decision, consult the latest BEA release and local housing indices, and use the EPI and MIT tools to translate prices into required incomes for your household Zillow research data.
BEA uses regional price parities that combine many consumer categories to estimate overall price-level differences across states and metro areas; they are intended for cross-state comparisons rather than short-term inflation tracking.
Use BEA RPPs to compare states for broad price-level differences, and use BLS CPI-area series to track recent local inflation; combining both with local housing data yields the most practical estimate.
Housing costs typically explain the largest share of interstate differences, but groceries, healthcare and utilities can be decisive for some households, so check category-level indexes as well.
References
- https://www.bea.gov/data/prices-inflation/regional-price-parities-state-and-metro-area
- https://www.zillow.com/research/data/
- https://www.bls.gov/cpi/
- https://michaelcarbonara.com/contact/
- https://research.c2er.org/
- https://livingwage.mit.edu/
- https://www.epi.org/resources/budget/
- https://www.visualcapitalist.com/ranked-us-states-from-most-to-least-expensive/
- https://michaelcarbonara.com/issues/
- https://fred.stlouisfed.org/release/tables?eid=233639&rid=403
- https://michaelcarbonara.com/news/
- https://michaelcarbonara.com/
- https://taxfoundation.org/research/all/state/2026-state-tax-competitiveness-index/
{“@context”:”https://schema.org”,”@graph”:[{“@type”:”FAQPage”,”mainEntity”:[{“@type”:”Question”,”name”:”Which US state has the highest cost of living?”,”acceptedAnswer”:{“@type”:”Answer”,”text”:”Using BEA regional price parities and housing indices, states such as California, New Jersey and Hawaii commonly appear among the highest-priced; housing is usually the dominant driver and local housing data should be checked for decisions.”}},{“@type”:”Question”,”name”:”How does BEA measure state price differences?”,”acceptedAnswer”:{“@type”:”Answer”,”text”:”BEA uses regional price parities that combine many consumer categories to estimate overall price-level differences across states and metro areas; they are intended for cross-state comparisons rather than short-term inflation tracking.”}},{“@type”:”Question”,”name”:”Should I rely on CPI or RPP when planning a move?”,”acceptedAnswer”:{“@type”:”Answer”,”text”:”Use BEA RPPs to compare states for broad price-level differences, and use BLS CPI-area series to track recent local inflation; combining both with local housing data yields the most practical estimate.”}},{“@type”:”Question”,”name”:”Which costs matter most when comparing states?”,”acceptedAnswer”:{“@type”:”Answer”,”text”:”Housing costs typically explain the largest share of interstate differences, but groceries, healthcare and utilities can be decisive for some households, so check category-level indexes as well.”}}]},{“@type”:”BreadcrumbList”,”itemListElement”:[{“@type”:”ListItem”,”position”:1,”name”:”Home”,”item”:”https://michaelcarbonara.com”},{“@type”:”ListItem”,”position”:2,”name”:”Blog”,”item”:”https://michaelcarbonara.com/blog”},{“@type”:”ListItem”,”position”:3,”name”:”Artikel”,”item”:”https://michaelcarbonara.com”}]},{“@type”:”WebSite”,”name”:”Michael Carbonara”,”url”:”https://michaelcarbonara.com”},{“@type”:”BlogPosting”,”mainEntityOfPage”:{“@type”:”WebPage”,”@id”:”https://michaelcarbonara.com”},”publisher”:{“@type”:”Organization”,”name”:”Michael Carbonara”,”logo”:{“@type”:”ImageObject”,”url”:”https://lh3.googleusercontent.com/d/1eomrpqryWDWU8PPJMN7y_iqX_l1jOlw9=s250″}},”image”:[“https://lh3.googleusercontent.com/d/1BJyS-AnCpvuc-KnaHoY10Ryjv1gMd-IT=s1200″,”https://lh3.googleusercontent.com/d/16KvJ4EUSdEmXPSUIyB1ZkKb8Ek9xlbPe=s1200″,”https://lh3.googleusercontent.com/d/1eomrpqryWDWU8PPJMN7y_iqX_l1jOlw9=s250”]}]}